
Bottling performance measurement
Bottling Line OEE Calculation and Loss Review
Use one consistent production window to separate downtime, speed loss and rejected output instead of hiding different problems inside one efficiency percentage.
Published by Allot Tech. Project contact: founder Mr Kcal. Final engineering, performance, materials, compliance, manufacturing responsibility and commercial terms must be confirmed for the selected resource and signed project scope.
Updated October 7, 2026Direct answer
OEE is a loss-separation method, not a universal supplier benchmark.
Overall equipment effectiveness is availability multiplied by performance multiplied by quality. For a bottling line, availability compares operating time with planned production time; performance compares actual output with the theoretical output at the defined ideal rate during operating time; and quality compares accepted output with total output. Use one product, package, time window and counter boundary. The arithmetic is simple, but the result is only useful when planned time, downtime, ideal rate, total count and reject definitions are consistent and traceable.
Browser calculator
Bottling Line OEE Calculator
Use one consistent run boundary. Results are a planning scenario, not a capacity guarantee or contractual acceptance result.
Project definition
Start with the complete decision basis.
A line can miss schedule because it stops too often, runs below the defined rate or produces unacceptable packs. Those causes require different actions. A useful OEE record should therefore preserve raw time and count data, product and format, counter locations, planned-stop rules, downtime reasons, the approved ideal rate and quality disposition. The calculator below organizes one scenario and does not guarantee capacity or replace the plant operating record.
Time boundary
Shift or run start and end, excluded planned stops, planned production minutes and recorded unplanned downtime.
Ideal rate
Approved ideal BPH for the named bottle and product at the selected line boundary.
Production counts
Total containers at the chosen counter, accepted output and rejects or rework under one definition.
Loss coding
Stop start and end, machine or zone, reason, speed-loss evidence, reject reason and responsible review owner.
System or development path
Build OEE from raw events and counts before discussing improvement.
Fix the boundary
Name the line, product, package, shift, start and end time, output counter and quality decision point.
Calculate planned time
Separate scheduled production from agreed excluded time without hiding changeovers or cleaning by default.
Record operating time
Subtract recorded unplanned stops and preserve reason, duration, machine and evidence for each event.
Apply ideal rate
Use the approved ideal cycle or rate for the actual format and avoid mixing several products without weighted raw data.
Count accepted output
Define good output, rejects, rework and counter reconciliation so quality loss is reproducible.
Rank the losses
Use availability, performance and quality details to select the largest evidence-supported action, then remeasure.
Quotation comparison
Agree the OEE data definitions before comparing shifts or lines.
| Decision area | Buyer should provide | Proposal should clarify |
|---|---|---|
| Planned time | Schedule, breaks, cleaning and changeover rules. | Included and excluded time categories with consistent timestamps. |
| Ideal rate | Product and format-specific approved basis. | Source of ideal cycle time, line boundary and treatment of rate changes. |
| Downtime | Event log with reason and duration. | Automatic and manual coding, micro-stop treatment and unresolved events. |
| Quality | Good, reject and rework definitions. | Counter location, inspection boundary, late rejects and reconciliation method. |
| Improvement review | Baseline period and operating context. | Loss ranking, action owner, due date, verification window and changed conditions. |
Solve the next project problem
Close these proposal gaps before price becomes the decision.
Use the brief below to turn a vague supplier conversation into questions that can be answered and documented.
Make this decision comparable.
Send: Schedule, breaks, cleaning and changeover rules.
Require: Included and excluded time categories with consistent timestamps.
Make this decision comparable.
Send: Product and format-specific approved basis.
Require: Source of ideal cycle time, line boundary and treatment of rate changes.
Make this decision comparable.
Send: Event log with reason and duration.
Require: Automatic and manual coding, micro-stop treatment and unresolved events.
Send the beverage, package files, required output, factory conditions, destination and current project stage. The Allot Tech Project Desk can help organize the first comparison.
Decision evidence
Keep the score connected to the underlying production record.
Evidence should be identified before the order or approval stage so both sides know what will support the next decision.
Run identity
Record line, product, package, shift, operators, counter boundary and approved ideal rate.
Time-event log
Preserve planned intervals, stop timestamps, reason codes, micro-stops and manual corrections.
Count reconciliation
Connect total, accepted, rejected and reworked units across the agreed quality boundary.
Loss action record
Name the largest loss, evidence, countermeasure, owner, due date and post-change measurement.
Do not average percentages without the raw basis
Different products and run lengths cannot be combined reliably by taking a simple average of OEE percentages. Retain planned time, operating time, ideal cycle, total count and good count for each run so the combined result can be weighted correctly.
- Store raw time and count fields
- Separate product and format runs
- Document every aggregation rule
Use the correct loss owner
Availability loss may point to breakdowns, changeovers or material shortages; performance loss may point to starvation, blocking or reduced speed; quality loss may point to process, package or inspection problems. Route the action to the evidence, not the headline score.
- Rank component losses separately
- Review stop and reject Pareto data
- Assign actions to named owners
Keep contractual acceptance separate from operating OEE
A FAT or performance guarantee uses signed conditions, materials, duration and acceptance rules. Routine OEE uses plant operating data. One can inform the other, but the calculator should not be presented as a contractual performance promise.
- Keep FAT conditions in the agreement
- Use OEE for operating improvement
- Label assumptions and data sources
Decision gates
Move forward when the next commitment has enough written evidence.
Project stages overlap, but each commercial commitment should have a visible basis, named approvers and a list of unresolved items.
Engineering basis approved
The product, package, output, equipment boundary, layout, utilities, responsibilities and open assumptions are controlled.
Manufacturing and test basis approved
Drawings, component schedule, test materials, acceptance conditions, documents and planned evidence are agreed.
Delivery and handover released
Punch-list closure, packing, shipment files, site readiness, installation scope, training and support ownership are visible.
Before requesting a proposal
Build one brief that every resource can answer on the same basis.
This page is designed to help an international buyer prepare a clearer discussion, not to replace the responsible resource’s engineering or the buyer’s professional review.
Product
Beverage, process, hygiene, shelf-life and operating conditions.
Package
Container, closure, label, code, finished pack and approved files.
Output
Required rate for a named format, shifts, annual plan and changeovers.
Factory
Measured space, utilities, access, drainage and local site constraints.
Project scope
Equipment boundary, documents, FAT, delivery, startup and destination.
Allot Tech organized recurring buyer questions, project-scoping patterns, available catalog inputs and specialist-resource context into a decision sequence. No customer case, certification, output guarantee or factory ownership is implied unless separately verified for the named project.
Reference basis
Primary and specialist sources used to frame the buyer questions.
These sources support definitions and planning context. The current edition, local requirements and project-specific acceptance criteria still need confirmation by the responsible parties.
- SAP Digital Manufacturing – OEE Calculations
Official product documentation defining OEE through availability, performance and quality.
- OEE.com – OEE Calculation FAQ
Specialist guidance on multi-product aggregation, raw data and limitations of cross-plant comparison.
Manufacturing context
Use equipment views to ask more specific project questions.
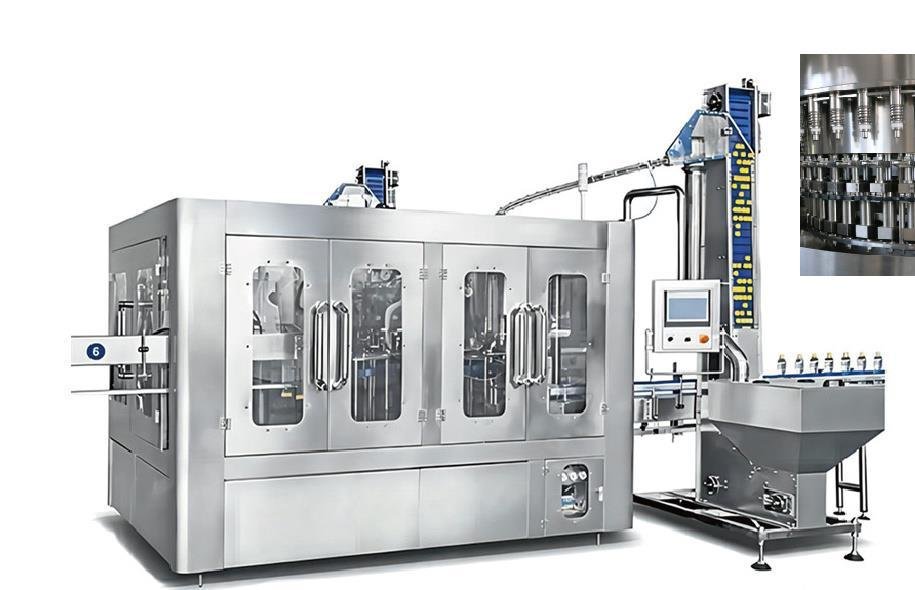
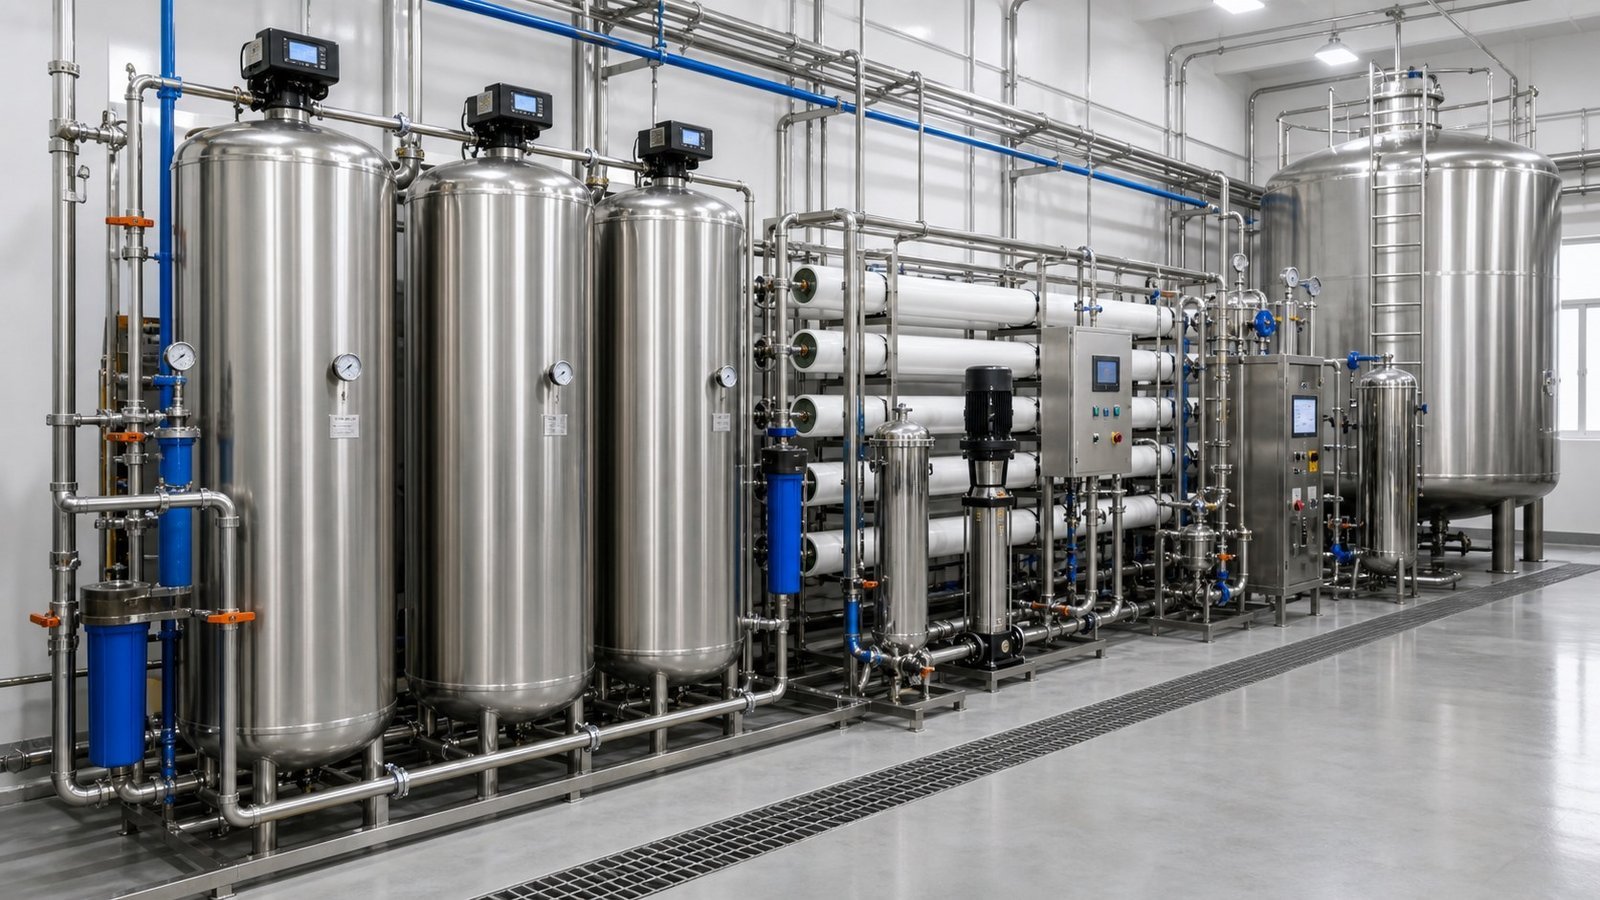
The process illustration supports scope discussion. The XGF equipment image is reproduced from page 9 of the Allot Tech 2026 catalog; use the catalog and project documents to review the applicable configuration.
Buyer questions
Frequently asked questions
What is the bottling line OEE formula?
OEE equals availability multiplied by performance multiplied by quality. Each component must use the same production boundary and period.
Can OEE be calculated for several bottle sizes together?
Yes when the underlying time, ideal cycle, total output and good output are retained by run and aggregated with a consistent method. A simple average of percentages is not enough.
What if performance is above 100 percent?
Check the ideal rate, time boundary, counter and units. A value above 100 percent usually indicates an inconsistent input or an ideal rate that is not the correct reference.
Does a high OEE prove line capacity?
No. OEE summarizes operation under a defined data basis. Contractual capacity requires agreed product, package, utilities, test conditions, duration and acceptance evidence.
Project discussion
Review a Bottling Line Loss Scenario
Send the beverage, package files, required output, factory conditions, destination and current project stage.